
David Bamford, Director at IMMER Ltd
Every year since 2021 Climate Trace has published its up-to-date collection of data covering almost 3 million separate sources around the planet; the easiest access to this data is via their map: Explore map - Climate TRACE | Climate TRACE
For various reasons, I am skeptical about the reliability of estimates for any one individual source but there is no doubt that some gross comparisons are valid eg Country X vs Country Y.
Below I summarize Climate Trace’s methane emission estimates for the UK and the EU, for 2021-2025. I have followed their Sector definitions; all the numbers shown are the estimate in thousands of metric tonnes for the UK or the EU, by year:
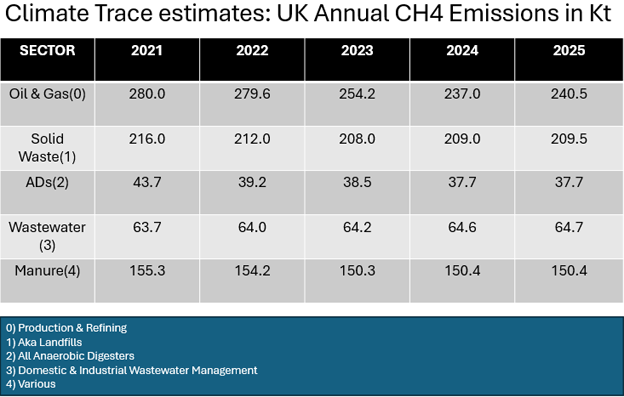
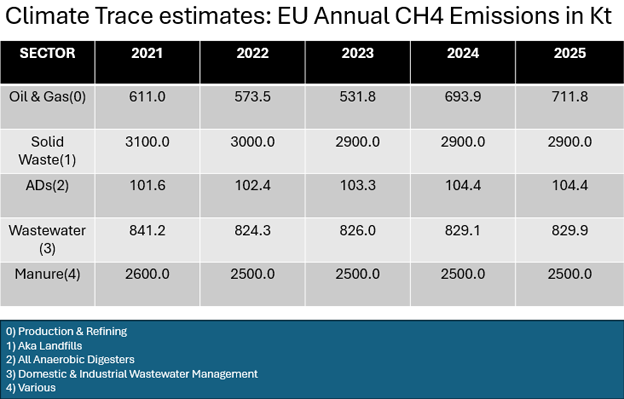
Some observations can be made immediately – in both the UK and the EU the total for the Waste sectors (the bottom 4 rows) is significantly more than the total for Oil & Gas; in the EU it is an order of magnitude more!
Furthermore, the population of the EU is roughly 6.5 times that of the UK; the EU’s total for the Waste sectors is close to 14 times that of the UK.
KeyFacts Energy: Commentary